At present, we can assume that the computers of the KNMI and other climate centers are recording 24 hours a day this week’s floods in northern Italy, or rather the extreme rainfall that caused these floods. Was it just extreme weather? Or can this be attributed to climate change?
KNMI scientist Geert-Jan van Oldenborgh, who died in 2021, was the driving force behind the Global Weather Allocation (W.W.A.), an international group of researchers who rapidly calculated current aspects of the climate using a variety of climate models and supercomputers.
The WWA is now a well-oiled machine that, weeks after an extreme weather event, issues an opinion on what climate change has to do with it. For the record: the WWA has indeed sometimes ruled that a flood, heat wave or drought had nothing to do with climate change – or it has acquitted the climate for lack of evidence.
“Impossible without climate change”
However, I wouldn’t be surprised if the WWA firmly blames these Italian floods on climate change in a while – I can dream the headlines already. Characteristic of the excitement that overwhelms journalists and activists is that they do not understand (unwilling) to understand the meaning of such a statement.
For example, the WWA may well judge that such extreme precipitation events are ten or a hundred times more likely in the climate we have today, compared to a hypothetical climate with no human emissions of “fossil” greenhouse gases. It has even happened that climatologists have described an extreme weather event as “impossible without climate change”.
Suppose that is also the verdict on these Italian floods. The public perception then is that without climate change there would have been no flooding in northern Italy this spring. This fits with the mainstream narrative that it’s not just climate change, but climate crisis, climate destruction and climate collapse.
This usage is fanatically fueled by the environmental movement, and the University of Amsterdam is now joining the frenzy by mandating terms such as “climate emergency” for climate change staff and students.
Those who delve a bit into how the WWA arrives at their judgments will understand how absurd this terminology is. In reality, such an unconditional attribution only means that without climate change, flooding would have occurred just as well, but slightly less. Sensational reports of an exceptional 47 degree heat wave, which has become a hundred times more likely due to climate change, also easily create the misperception that the climate is now completely out of control.
Optical illusion
What’s the real deal: That 47 degree heat wave is now as rare as a 44 or 45 degree heat wave would have been in an unheated climate. 44 degree heat waves are now a little less rare, but still as rare as 42 degree heat waves would have been in the non-fossil climate. And so on.
The huge increase in the risk of extreme weather due to a relatively small warming – 1.2 degrees – of the climate is statistically real, but in a way it is an optical illusion. To see it, you have to zoom in on the technical details. We take temperature as an example below, but so do other weather phenomena, such as droughts, precipitation, and storms.
For those who only follow the climate through the media, it will be hard to believe, but: due to climate change, temperatures compared to the average not or only slightly more extreme.
The probability distribution barely changes shape
If you graph how often a certain temperature occurs somewhere, you get a probability distribution like the red line in the image below: the average temperature occurs most often – this is the peak of the curve – and at the same time to the cold and to the Warm side, the extremes are becoming increasingly rare. The red curve is the current climate which has already warmed; the green curve is the hypothetical climate 1.2 degrees cooler if we had never started burning coal, oil and gas.
The bottom line is this: due to global warming, the entire probability distribution shifts slightly to the right, but it hardly changes shape. If there really was climate degradation – the international press’s favorite cry of alarm – then that probability distribution would change beyond recognition, but that’s not how the greenhouse effect affects the climate just a few degrees warmer.
Now if you have a fixed limit for what constitutes an extreme temperature – say 30 degrees, the purple line on the graph – the green shaded area shows how often it is over 30 degrees in the cool climate, and the shaded area red how often it is over 30 degrees in the current warm climate. In the photo, this already translates into an “extreme” temperature 3 to 4 times more often.
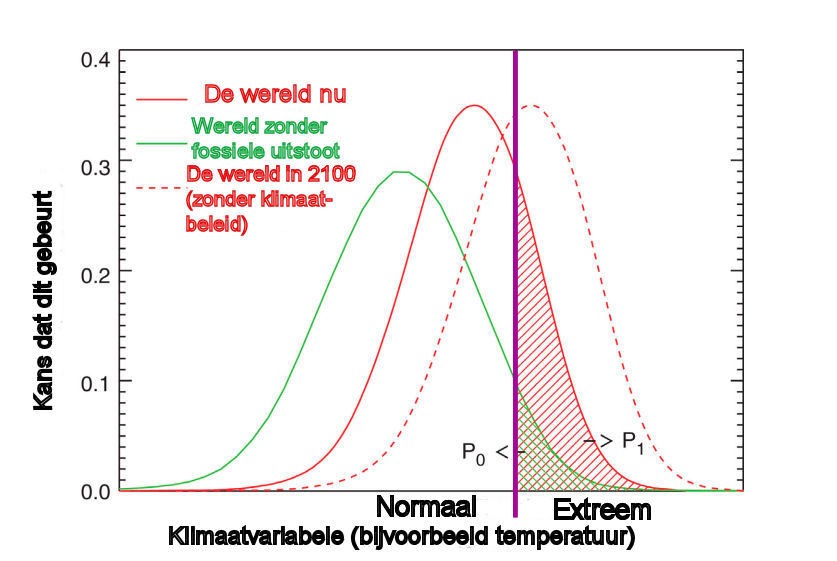
In reality, the “optical magnification” of the probability of extreme weather events is much stronger. Because to keep it visually manageable, the shifts between the three probability distributions are shown unrealistically in the image above, with a warming of around ten degrees, when the actual warming of the climate is currently only 1.2 degrees.
Excitement for rare outliers
The border between “normal” and “extreme” was also chosen very moderately. After all, the red shaded area apparently comprises a quarter of the red probability distribution, so it is now “extremely hot” a quarter of the time in this image, and in the non-fossil climate which is 3-4 times rarer ( shaded green area).
In fact, media excitement is always about much rarer outliers, for example, occurring only 1/1000 of the time. So you have to imagine that the purple line is much further to the right, say above the second letter e in ‘extreme’. The areas shaded in green and red will then both become much smaller, but their ratio will become even more unbalanced: with this limit for extreme weather, this would happen about ten times more often in the current climate than in the non- fossil.
Are you still there? In short: the more extreme the weather, the greater the likelihood of this happening with relatively little warming of the climate. It doesn’t mean the climate is “collapsed” at all, or words to that effect. The climate continues to operate as it always has, but at a slightly higher average temperature. This amazing multiplication of the probabilities of extreme weather is the result of how we define extreme weather and how temperature and other weather characteristics behave statistically.
Strive for an optimal combination of mitigation and adaptation
This simple image also symbolically illustrates something else: the tension between mitigation and adaptation. Mitigation is the prevention of climate change by reducing global greenhouse gas emissions. Adaptation consists of taking measures to mitigate the consequences of climate change, for example by raising dikes. In this case, the purple line indicates the limit of an extreme water level that a country’s sea walls can just barely support.
Attenuation attempts to slow and stop the shift of the entire probability distribution to the right; adaptation moves the purple band to the right with the probability distribution. Neither is perfect, the optimal mix is somewhere in between, partly depending on local conditions. But where is this optimum? This is what any reasonable discussion of climate change should be about.
Science journalist Arnold Jasper is the best-selling author “The Nitrogen Trap”. His columns appear every Saturday in Wynia’s Week.
In the month of June 2023 go Arnout Jaspers on tour through the Netherlands along halls, events, clubs and bookstores. Look elsewhere in Wynia’s Week where exactly! Organizers can report to [email protected]
Wynia’s weekappears 104 times a year with independent and indispensable reports that are freely accessible to all. Donors make this possible. Are you in? THANKS!

“Infuriatingly humble social media ninja. Devoted travel junkie. Student. Avid internet lover.”